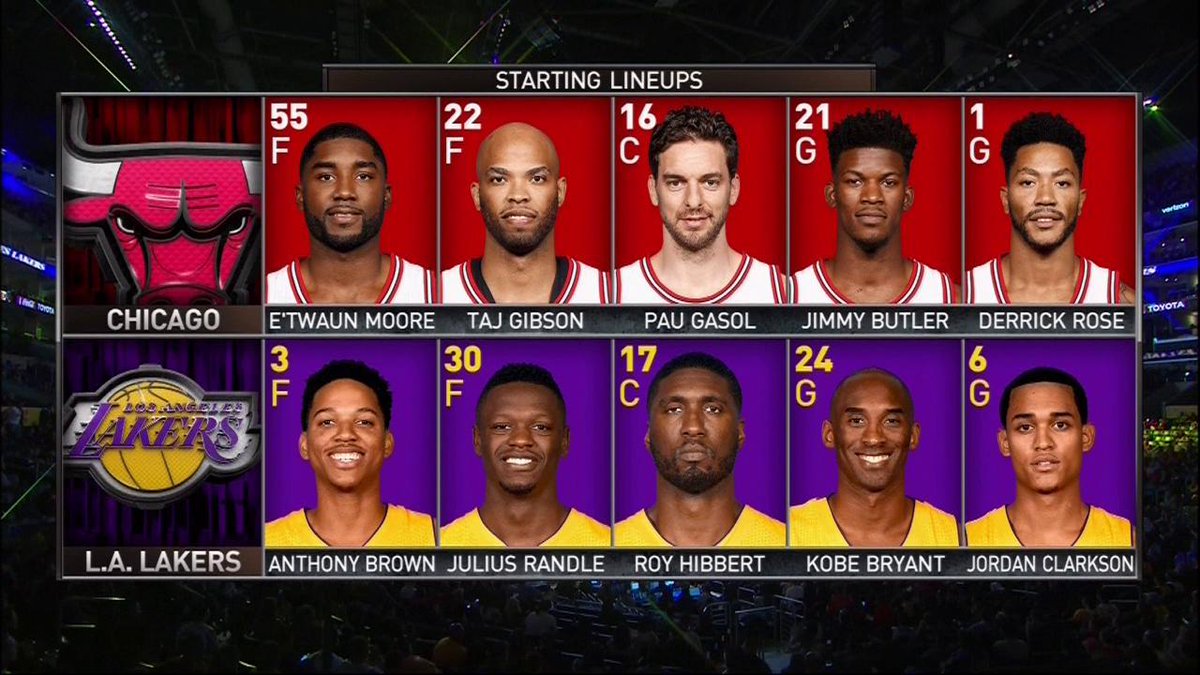
Shiny App that visualizes Lineup Shot Distribution EFficiency from the 16/17 NBA Season
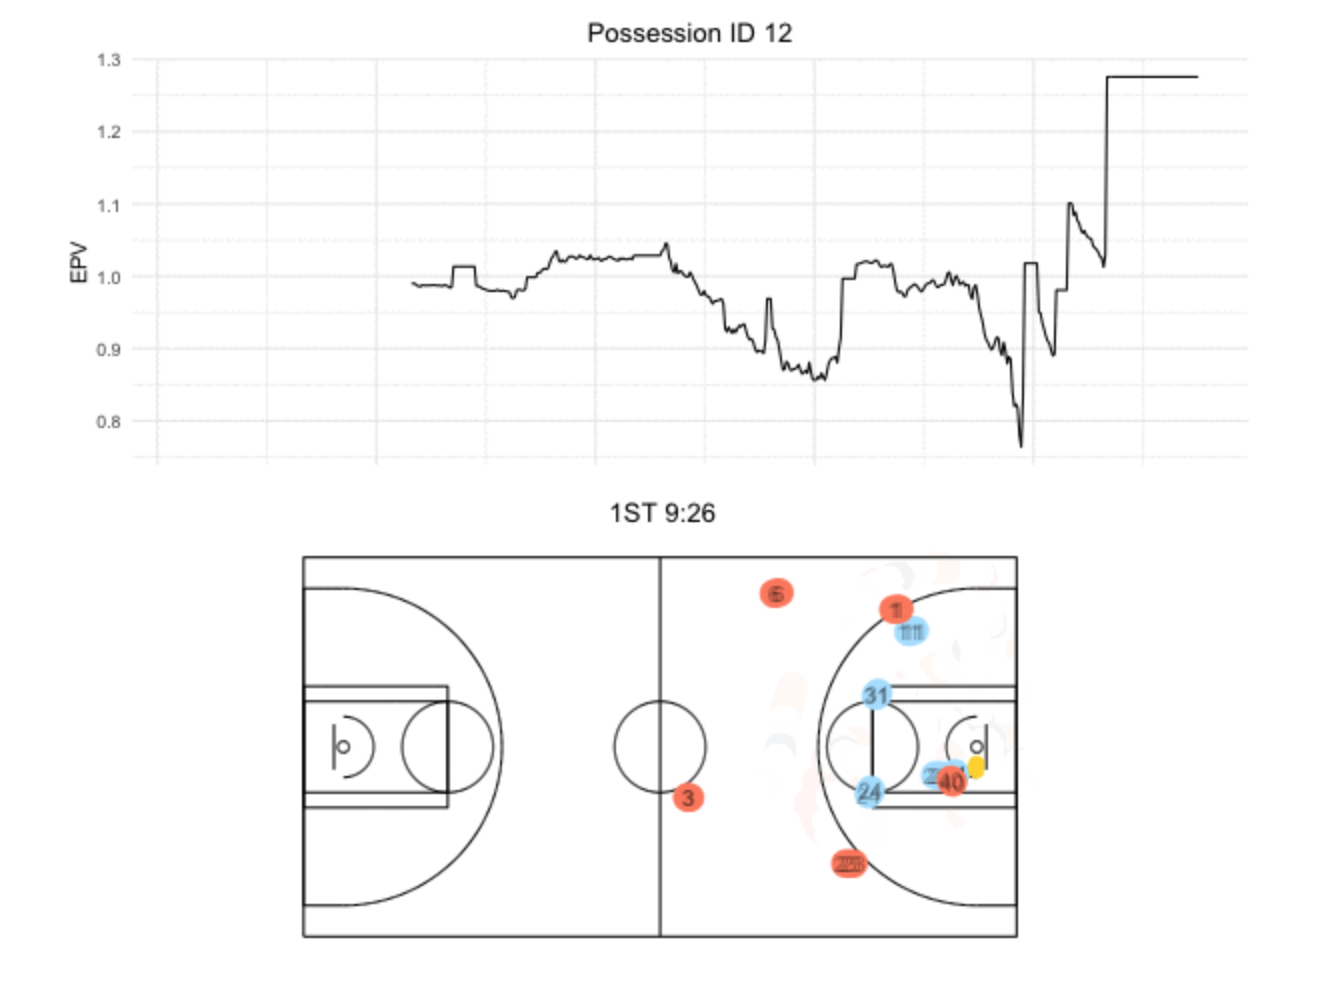
Shiny App that accompanies my blogpost called "Animating Expected Possession Value in the NBA"
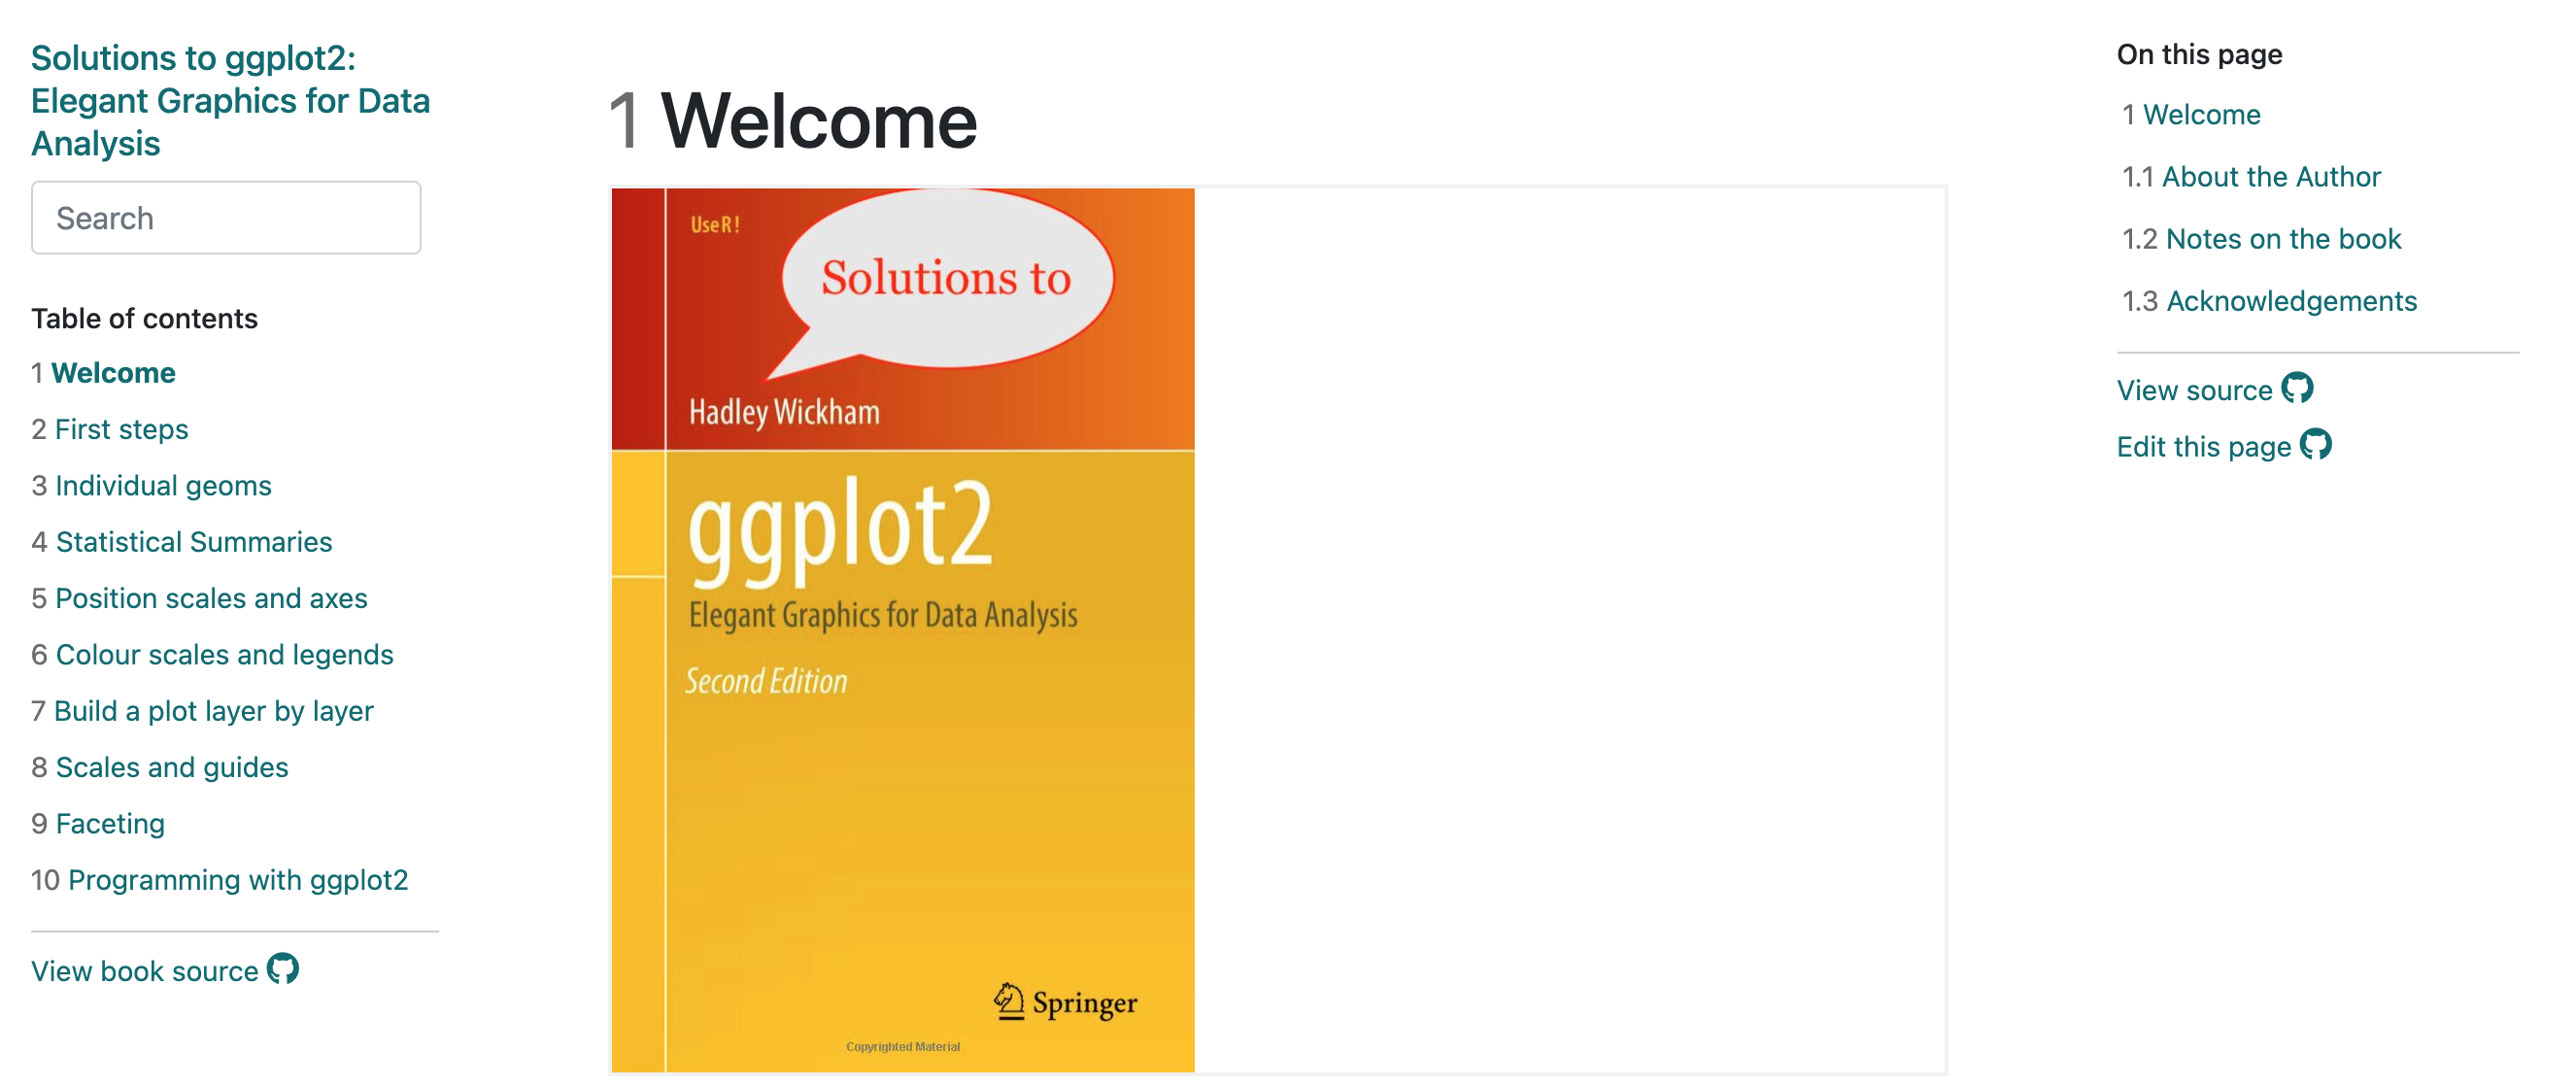
Solutions Manual to the exercises in the 3rd edition of ggplot2: Elegant Graphics for Data Analysis written by [Hadley …
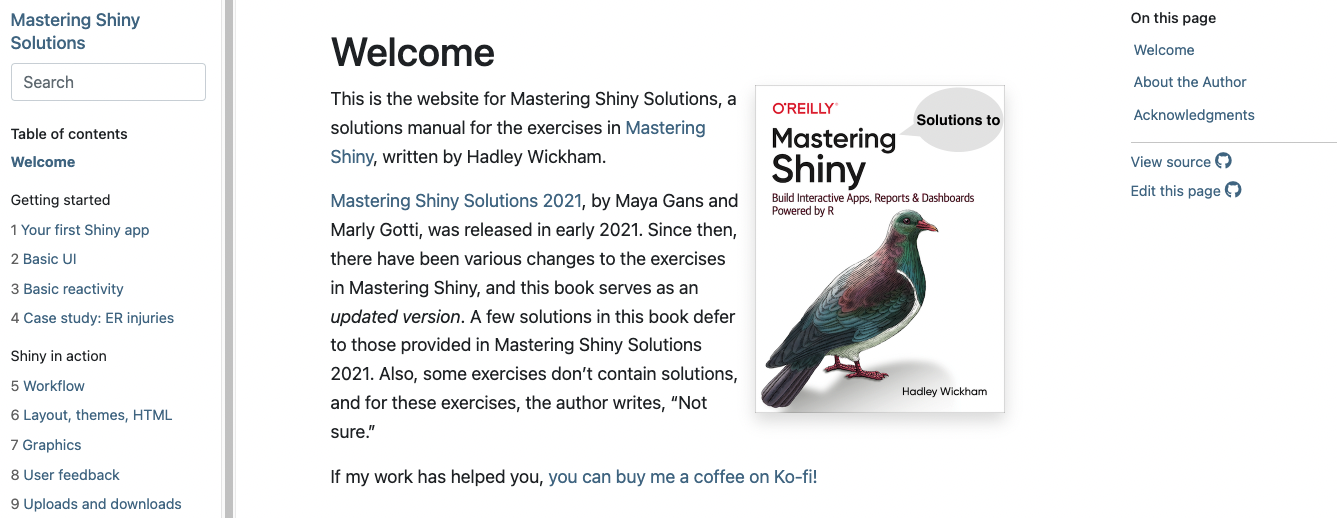
Solutions Manual for the exercises in Mastering Shiny, written by Hadley Wickham
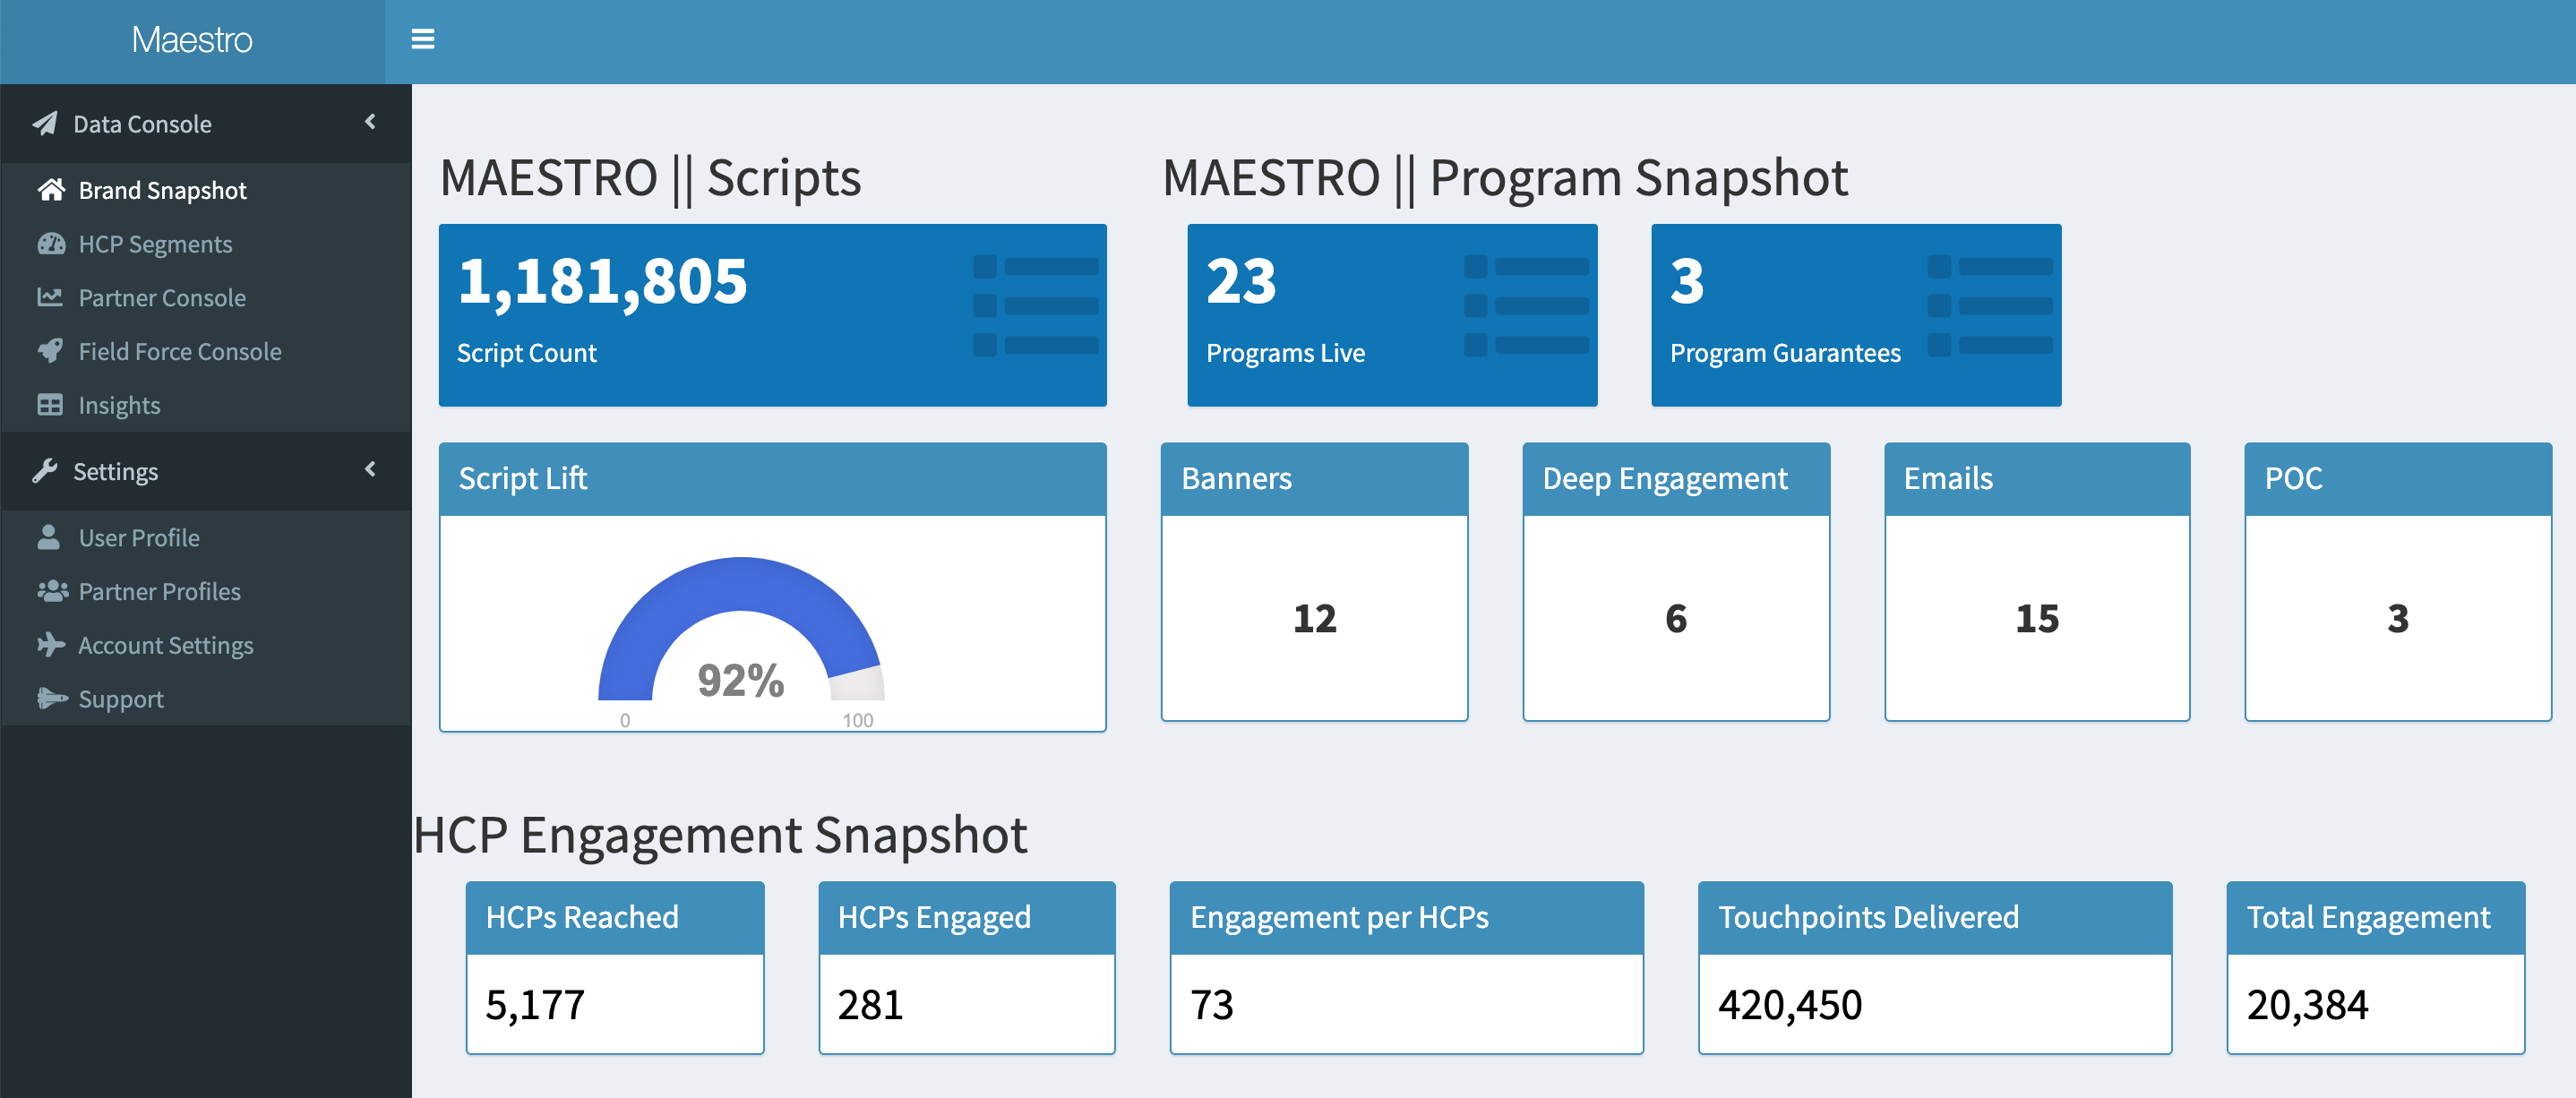
An Example Shiny Dashboard I created called Maestro
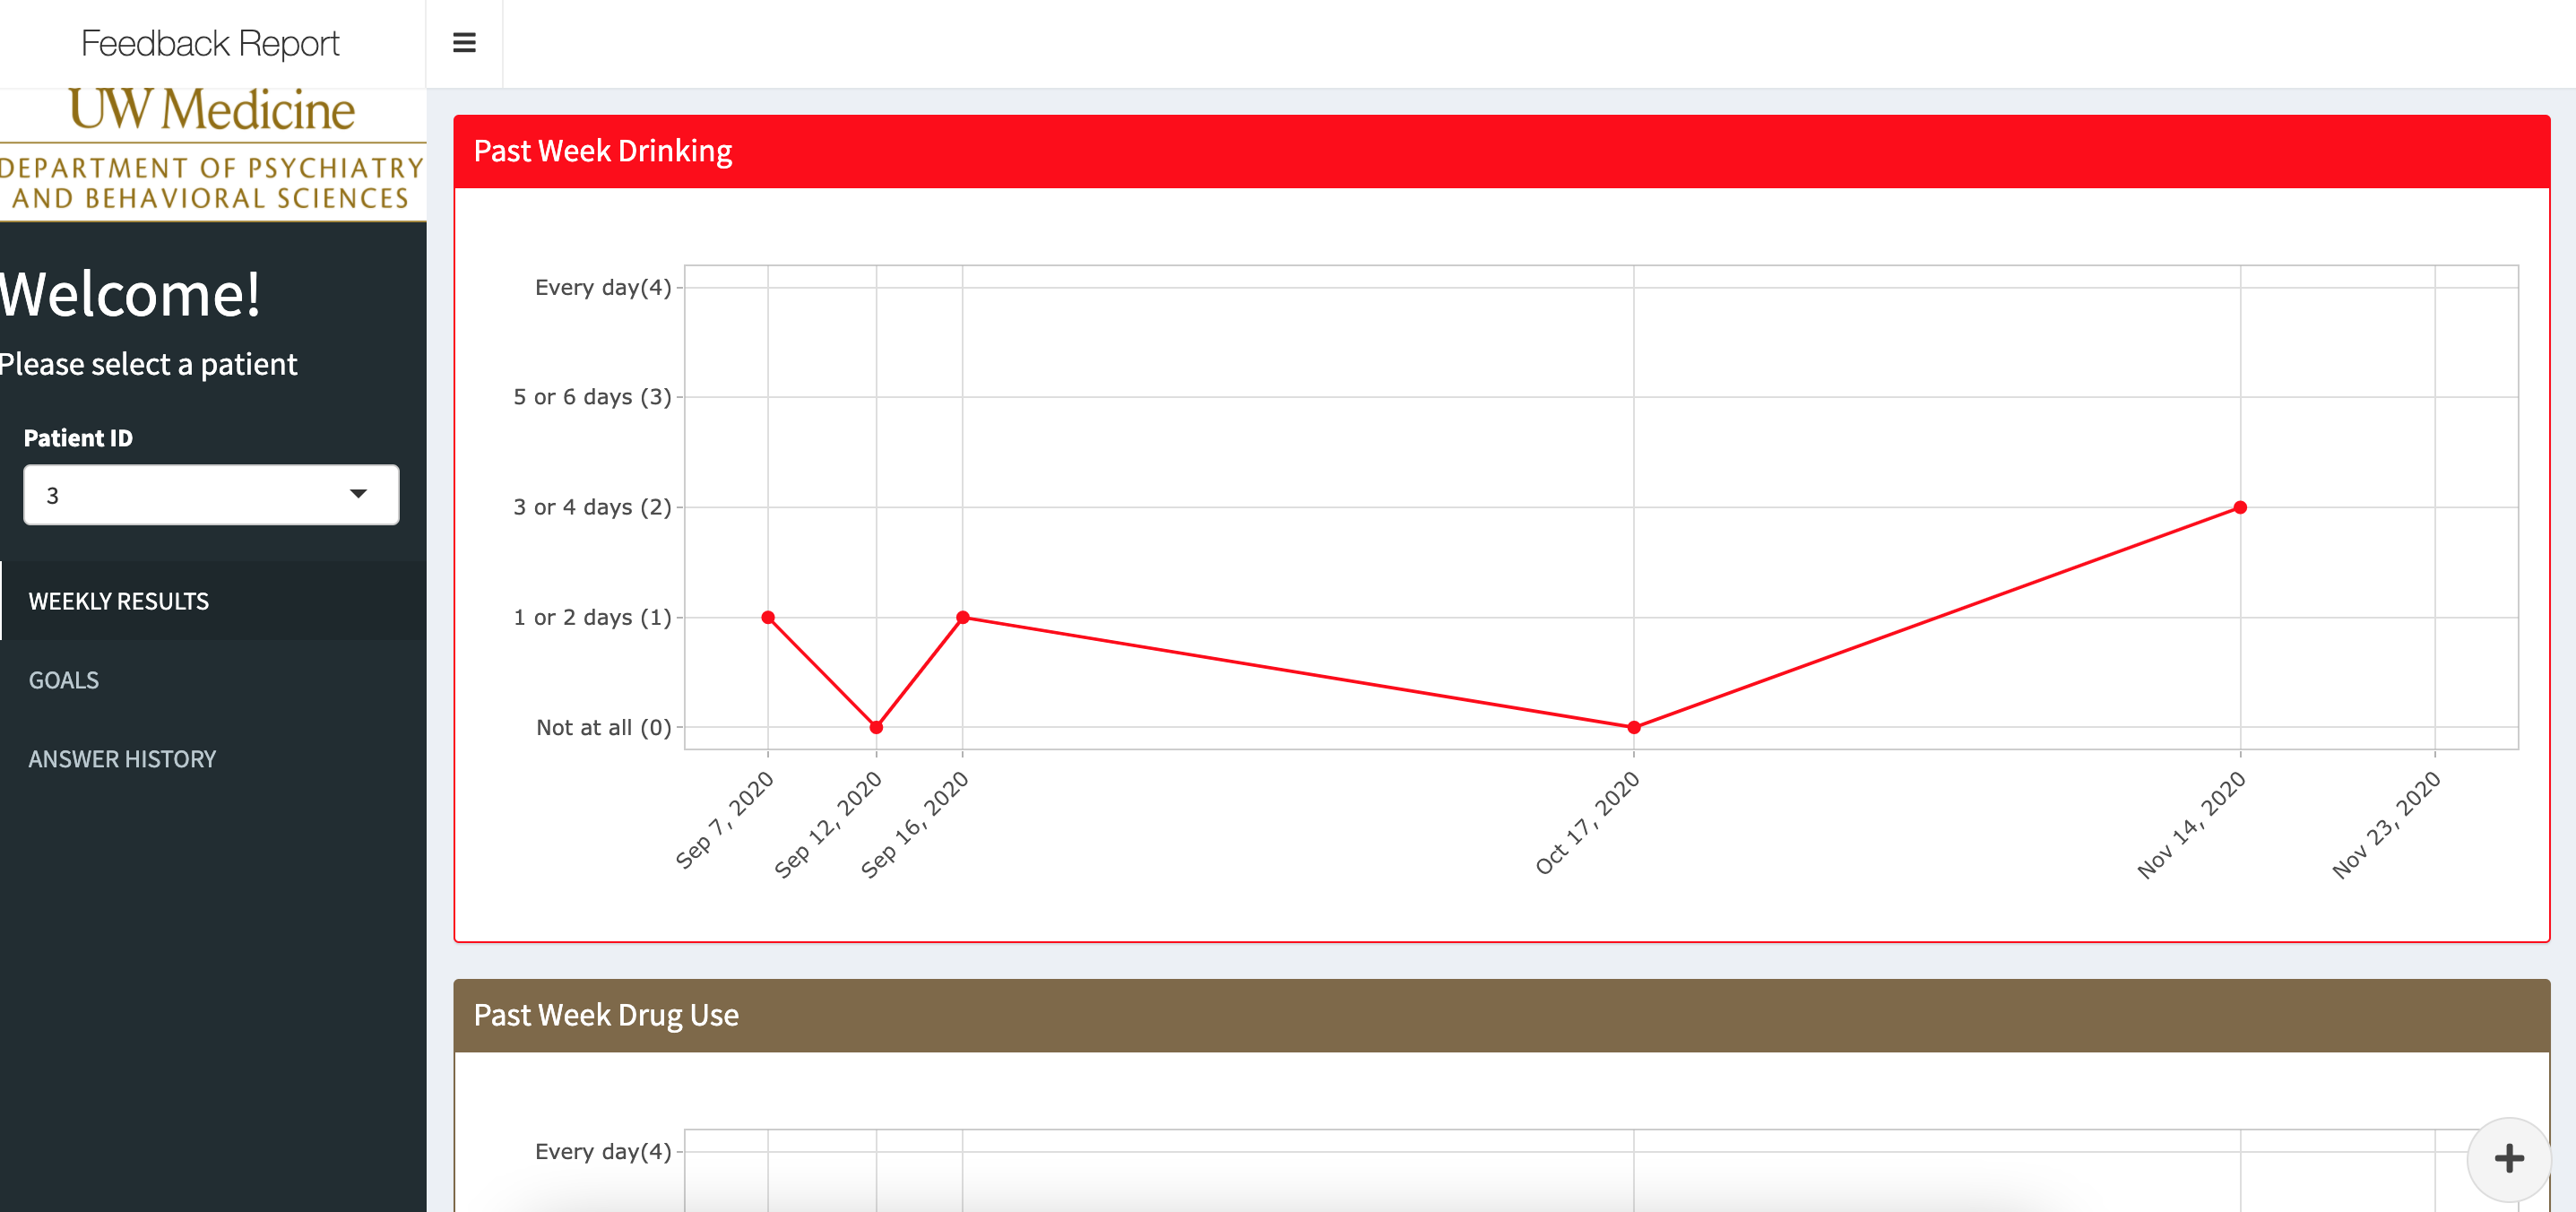
A Web-Based Shiny Dashboard for displaying Patient-Reported Outcome Measures for Patients in Addiction Treatment
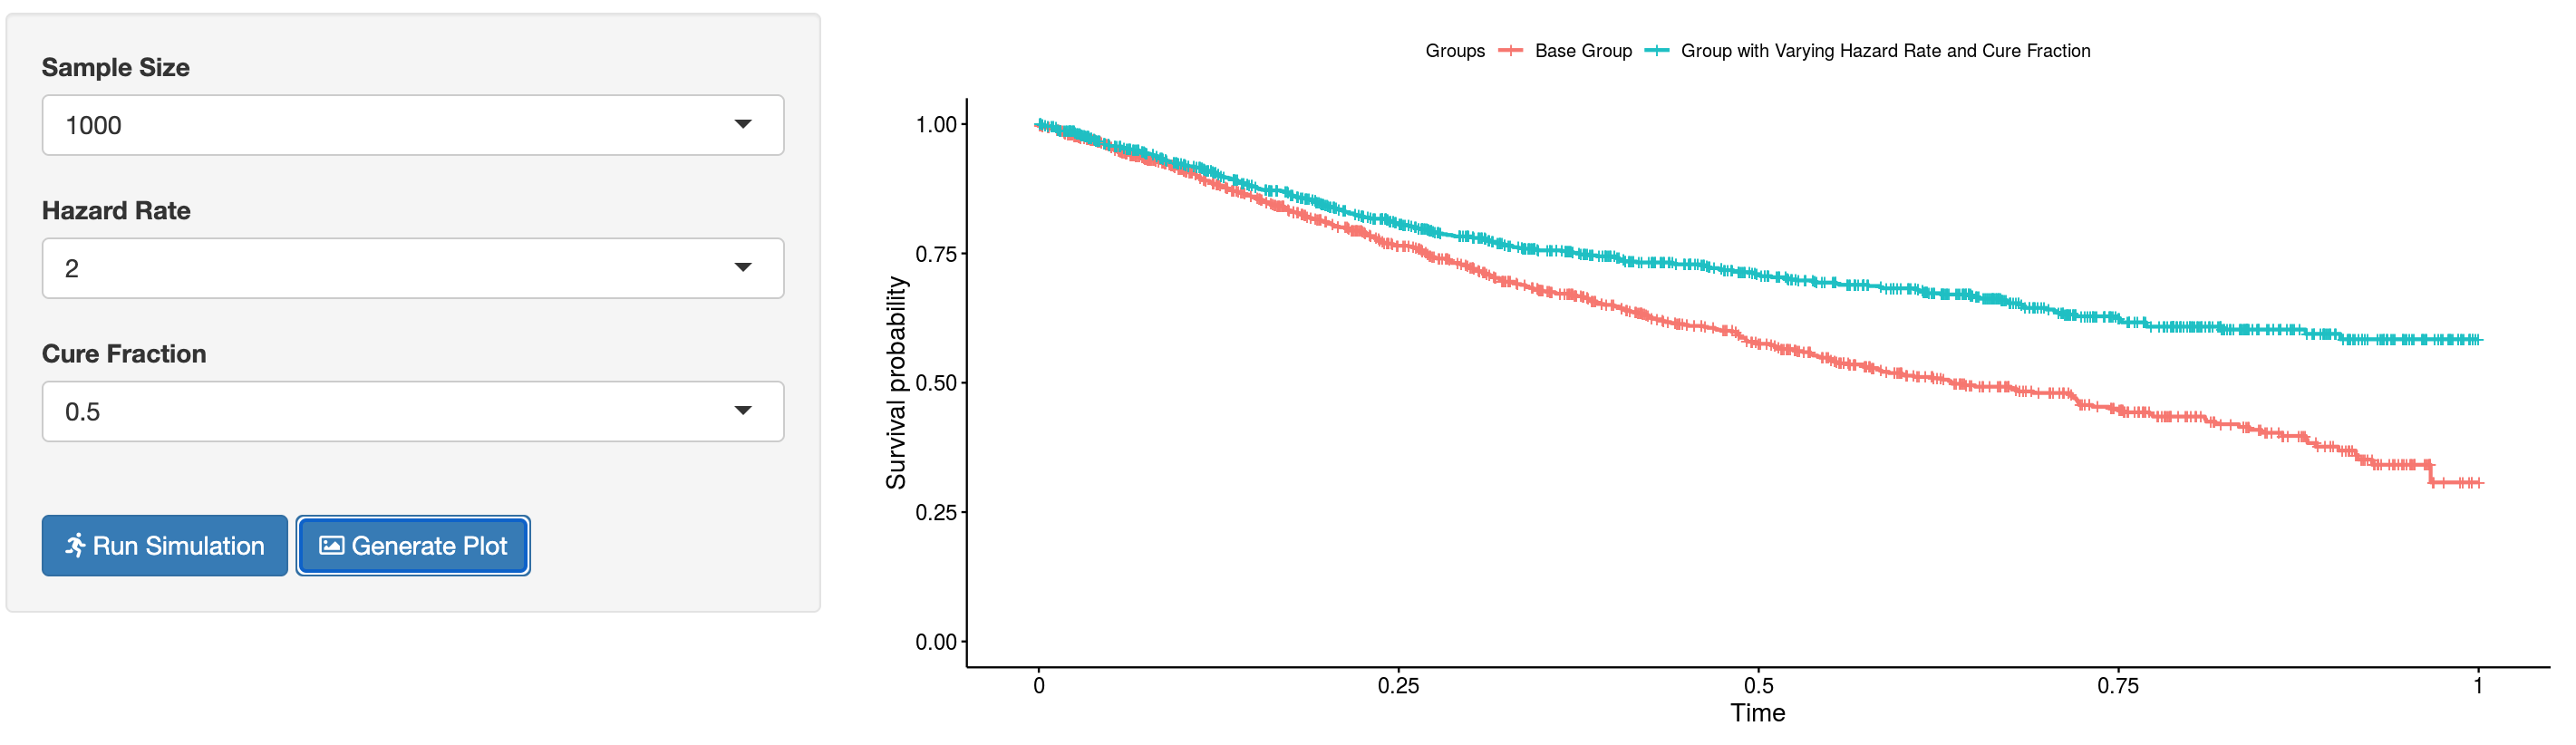
Simulation of a Parametric Mixture Cure Model
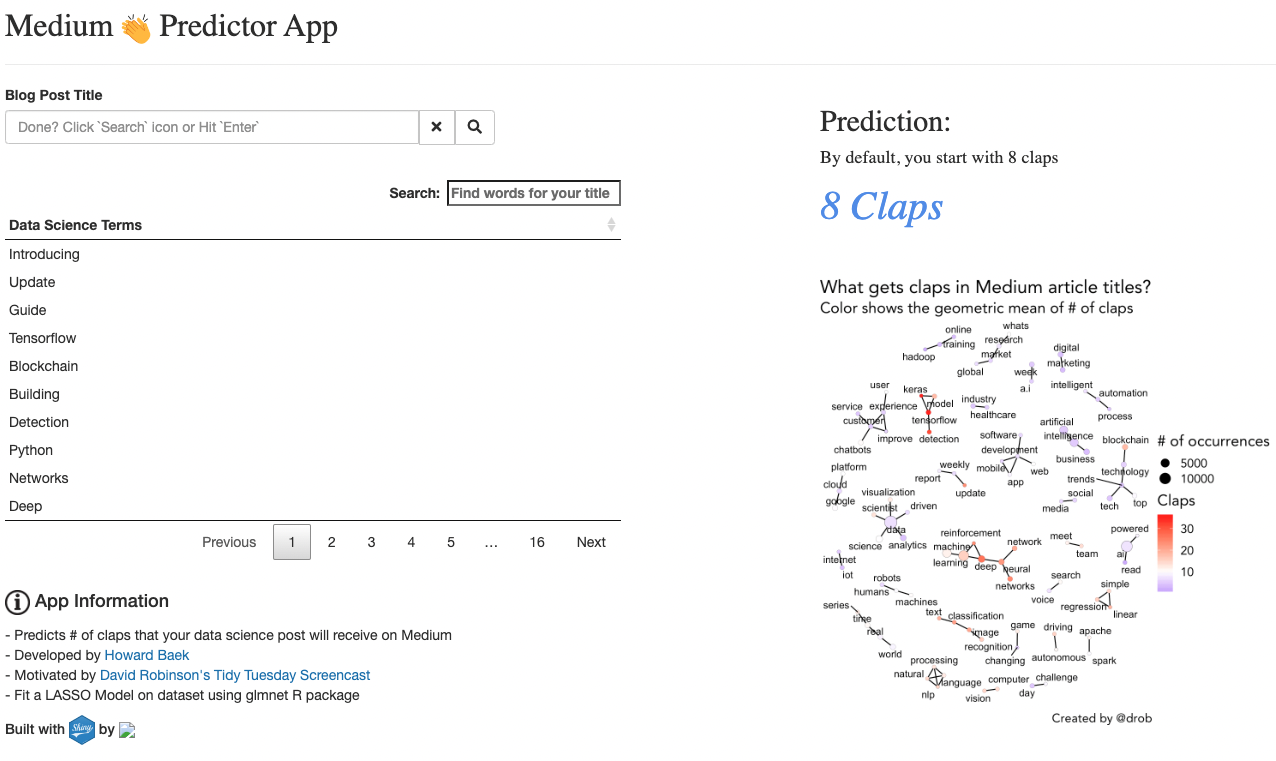
Shiny App that predicts the number of claps a blog post will receive solely based on the blog post title
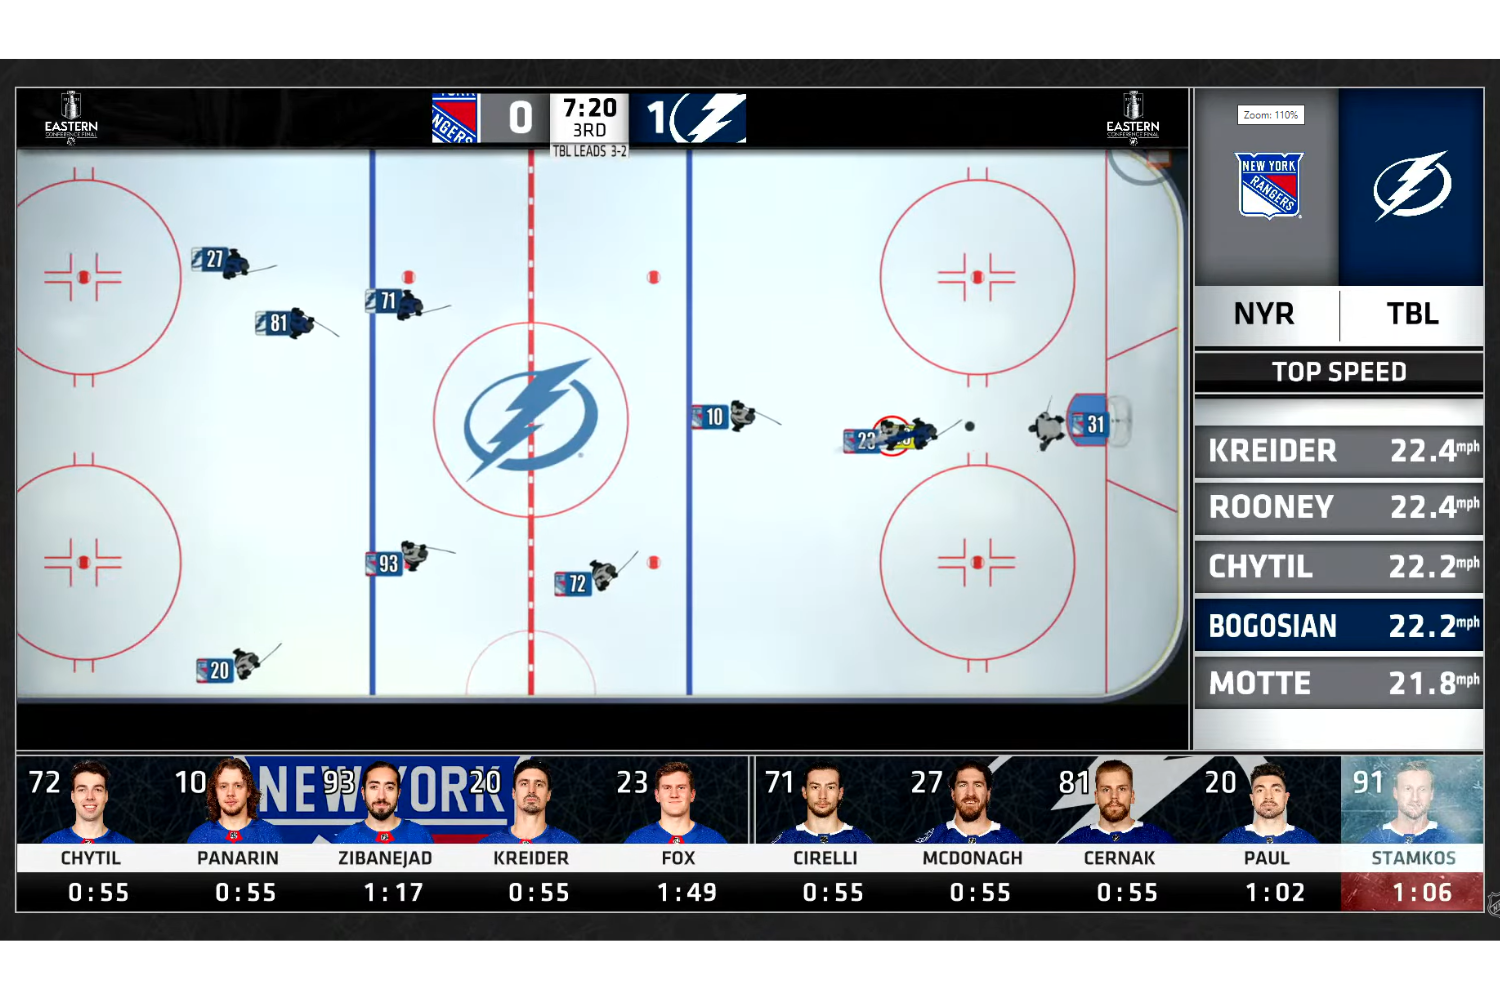
Shiny App that visualizes NHL Play-by-Play Data